Hello, I have a problem that I think is relatively simple, but can’t seem to figure out exactly what to do.
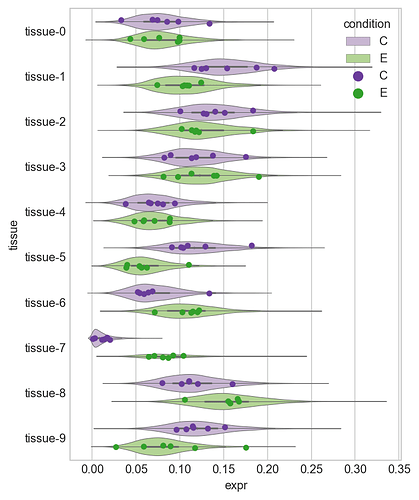
I have measured a protein’s expression in two groups, a control and experimental, across 10 tissues. I have measured the expression in 6 replicates for each condition across all 10 tissues. Therefore, I have 10 \times 6 \times 2 measurements. The values are all greater than or equal to 0 (i.e. 0 or positive) and the sum of the values for each replicate sum to 1.
I want to know if the expression of the protein is different between control and experiment in each tissue.
Because of the constraint on the values being \ge0 and summing to 1 across replicates, I think I should use a Dirichlet likelihood, but can’t put anything too useful together so far.
Here is code to generate some toy data:
N_TISSUES = 10
N_REPS = 6
CONDITIONS = ["C", "E"]

TISSUES = [f"tissue-{i}" for i in range(N_TISSUES)]
REPS = [f"{CONDITIONS[0]}-{i}" for i in range(N_REPS)]
REPS += [f"{CONDITIONS[1]}-{i}" for i in range(N_REPS)]

np.random.seed(909)
ctrl_tissue_props = np.random.uniform(0, 1, N_TISSUES)
ctrl_tissue_props = ctrl_tissue_props / np.sum(ctrl_tissue_props)
expt_tissue_props = np.random.uniform(0, 1, N_TISSUES)
expt_tissue_props = expt_tissue_props / np.sum(expt_tissue_props)

print("Real proportions for each tissue:")
print(np.vstack([ctrl_tissue_props, expt_tissue_props]).round(3))
#> Real proportions for each tissue:
#> [[0.134 0.021 0.067 0.104 0.054 0.124 0.225 0.096 0.021 0.153]
#>  [0.044 0.189 0.004 0.049 0.036 0.18  0.138 0.137 0.185 0.036]]

_ctrl_data = np.random.dirichlet(ctrl_tissue_props*100, N_REPS).T
_expt_data = np.random.dirichlet(expt_tissue_props*100, N_REPS).T

expr_data = pd.DataFrame(np.hstack([_ctrl_data, _expt_data]), columns=REPS).assign(tissue=TISSUES).set_index("tissue")
expr_data.round(3)
The sum across tissues (rows) for each replicate (columns) is equal to 1:
expr_data.values.sum(axis=0)
#> array([1., 1., 1., 1., 1., 1., 1., 1., 1., 1., 1., 1.])
My plan is to eventually add hierarchical relationships and add another dimension because I have measured the expression of more proteins, but I would greatly appreciate anyone’s help to get me started on the right path. Thank you!


