I have tried using the ax object from
ax = az.plot_posterior( idata )
but there are no way that I can get ax to do this. Any matpltotlib plot I have ever done always give me all four axes.
I have tried using the ax object from
ax = az.plot_posterior( idata )
but there are no way that I can get ax to do this. Any matpltotlib plot I have ever done always give me all four axes.
I am afraid I need more information to try and help. Axes could refer to either the matplotlib object (subplot below) or to the dimensions in a numpy array.
Is the issue with the number of subplots generated and their layout? For example, getting a single row with 4 subplots instead of a 2x2 grid of subplots.
Or is the issue with the shape of the array returned as ax? For example, getting a 1d array of length 4 (thus, shape (4,)) for a plot with 1 row and 4 columns instead of one with shape (1,4)
Or maybe something else entirely?
I am only trying to get a single plot. And this is what I am getting
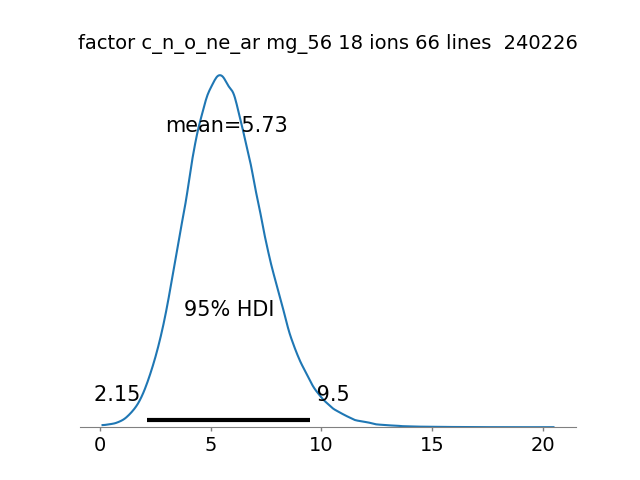
the is only a single x axis at the bottom. I would like to have one at the top and a yaxis on the left and right.
I am looking into how to do this by a combination of using ax.set_yticks() and ax.axvlilne() but there should be something more straightforward.
thanks for answering
If you go to where ever arviz is installed and go to subfolder
“/arviz/plots” and grep for yaxis you will see that the following function exists
def format_axes():
        ax.yaxis.set_ticks([])
        ax.spines["top"].set_visible(False)
        ax.spines["right"].set_visible(False)
        ax.spines["left"].set_visible(False)
        ax.spines["bottom"].set_visible(True)
        ax.xaxis.set_ticks_position("bottom")
        ax.tick_params(
            axis="x", direction="out", width=1, length=3, color="0.5", labelsize=xt_labelsize
        )
        ax.spines["bottom"].set_color("0.5")
inside ./backends/matplotlib/posteriorplot.py
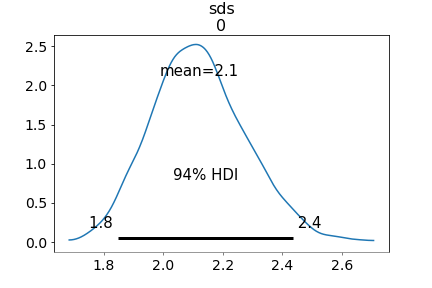
There does not seem to be any option to turn this off (atleast non that I could see with a quick look, but if there is, this would be the correct place to search for it). You can either add an extra option your self to posterior plot or comment these parts out (if you are using matplotlib) which produces plots like
Most (all?) arviz plotting functions let you pass an axis or collection of axes via an ax argument. You can instantiate an axis, pass it in, then arbitrarily update it. For example:
import matplotlib.pyplot as plt
from matplotlib.ticker import AutoLocator
fig, ax = plt.subplots()
az.plot_posterior(idata.prior, var_names=['mu'], ax=ax);
[spine.set_visible(True) for spine in ax.spines.values()]
ax.yaxis.set_major_locator(AutoLocator())
plt.show()

That is how I would do it as well but I think op wants some arviz defined parameter to turn it off, which does not seem to exist
I am looking into how to do this by a combination of >using ax.set_yticks() and ax.axvlilne() but there should >be something more straightforward.
I would just suggest that whatever customization one wants done, it should be done by working with the ax object. There’s basically never any need to go in and hack the source files.
For example, ticking the top, left, and right:
fig, ax = plt.subplots()
az.plot_posterior(idata.prior, var_names=['mu'], ax=ax);
[spine.set_visible(True) for spine in ax.spines.values()]
ax.yaxis.set_major_locator(AutoLocator())
ax.xaxis.tick_top()
ax.tick_params(axis='y', which='both', tick2On=True, label2On=True)
plt.show()

thanks, this looks helpful