Hello,
I have a model that estimates average sales between three distinct groups for comparison between the groups. My model was based in part off of this post: Bayesian Estimation Supersedes the T-Test — PyMC3 3.11.5 documentation
I’d like to add a vertical line that represents the average of my observed data. See model below:
# Develop a probability model that corresponds to estimating the difference between the two
mean_sales = y.value.mean()
std_sales = y.value.std()*2
sigma_low = 1
sigma_high = 10

#set the mean to the mean of the entire group to pool the estimates within the entire dataset.  Set the pooled standard deviation to twice the standard deviation to account for any outliars within
#each group

with pm.Model() as model:
    promo_week_mean = pm.Normal("promo_week_mean",  mu = mean_sales, sigma=std_sales)
    promo_month_mean = pm.Normal("promo_month_mean",  mu = mean_sales, sigma=std_sales)
    nonpromo_mean = pm.Normal("nonpromo_mean", mu = mean_sales, sigma=std_sales)

    #assign uniform priors for standard deviations over our two groups for a plausible range of deviation of sales
    promo_week_std=pm.Uniform("promo_week_std", lower=sigma_low, upper=sigma_high)
    promo_month_std=pm.Uniform("promo_month_std", lower=sigma_low, upper=sigma_high)
    nonpromo_std=pm.Uniform("nonpromo_std", lower=sigma_low, upper=sigma_high)

    group1 = pm.Normal("promo_week", mu = promo_week_mean, sigma = promo_week_std,observed=promo_week)
    group2 = pm.Normal("nonpromo", mu = promo_month_mean, sigma=nonpromo_std, observed=nonpromo)
    group3 = pm.Normal("promo_month", mu = nonpromo_mean, sigma = promo_month_std, observed=promo_month)

    diff_of_means_week = pm.Deterministic("difference of means week", promo_week_mean - nonpromo_mean)
    diff_of_stds_week = pm.Deterministic("difference of stds week", promo_week_std - nonpromo_std)
    diff_of_means_month = pm.Deterministic("difference of means months", promo_month_mean - nonpromo_mean)
    diff_of_stds_month = pm.Deterministic("difference of stds months", promo_month_std - nonpromo_std)
    diff_of_promos_mean = pm.Deterministic("difference of means promos", promo_month_mean - promo_week_mean)
    diff_of_promos_std = pm.Deterministic("difference of stds promos", promo_month_std - promo_week_std)
    # effect_size = pm.Deterministic(
    #     "effect size", diff_of_means / np.sqrt((promo_std ** 2 + nonpromo_std ** 2) / 2)
    # )

    trace = pm.sampling_jax.sample_numpyro_nuts(draws = 1000, tune=1000, target_accept = .95, idata_kwargs={"log_likelihood": False})
Here is what I"m producing in terms of plots:
az.plot_posterior(
    trace,
    var_names=["promo_week_mean","promo_month_mean", "nonpromo_mean"],
    color="#87ceeb",
    # ref_val = promo_week.mean()
);
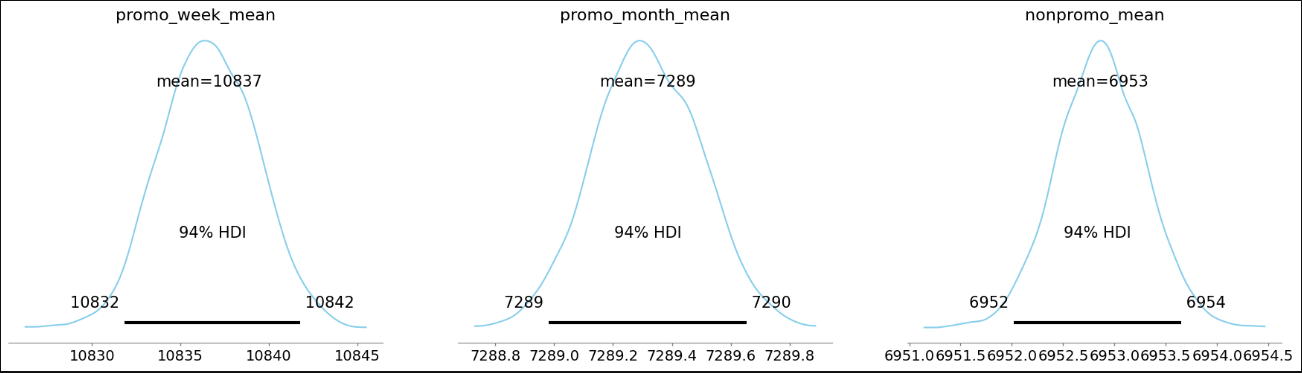
I know I can add a ref-value but I need to add three distinct ref values corresponding with actuals to the three distinct groups. Is there a way to do this or will I need to do one at a time?