I was wondering how do I create a multivariate AR1. As you will see below, if I try to do an AR1 with one dimension I get normal results, but the moment I scale up to 2 dimensions my results get very wacky (even though the two dimensions are independent).
with pm.Model() as warr_model:
warr_tau = pm.HalfNormal('warr_tau',sigma = 10)
warr_coef = pm.Normal('warr_coef',mu = 1, sigma = 20)
warr_ar1 = pm.AR1('warr_ar1',k = warr_coef, tau_e = warr_tau, shape = len(warr_fg3m))
game_sd = pm.HalfNormal("game_sd", sigma = 20)
y = pm.Normal('y',mu = warr_ar1,sigma = game_sd, observed = warr_fg3m)
I get normal results, as seen right here
If I do someething similar with New Orleans I also get normal results:
However, when I try to combine these two into a multivariate AR1 I get wacky results. Note in the code below, the results of New Orleans and the Warriors is independent.
with pm.Model() as warr_nola:
# This iss a combined model where we are doing analysis on both NOLA and Warriors
        comb_tau = pm.HalfNormal('comb_tau',sigma = 10,shape =2)

       comb_coef = pm.Normal('comb_coef',mu = 1, sigma = 20, shape = 2 )

       comb_ar1 = pm.AR1('comb_ar1',k = comb_coef, tau_e = comb_tau, shape = (40,2))

       comb_sd = pm.HalfNormal("comb_sd", sigma = 20,shape = 2)

       y_comb = pm.Normal('y_comb',mu = comb_ar1,sigma = comb_sd, observed = np.stack([nola_fg3m,warr_fg3m],axis =1))
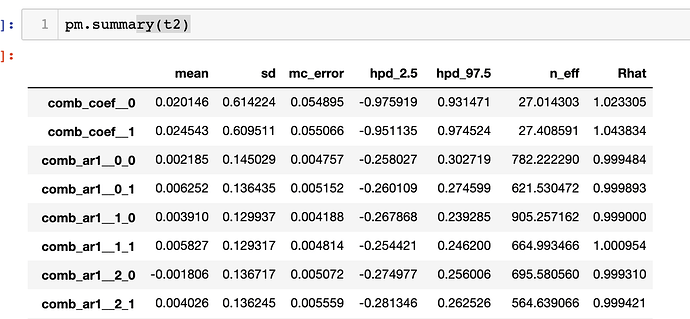
If I sample from this distribution, I get pretty wacky results that are significantly different:
Can someone please explain what’s going wrong. Also the wierdness is combing from the fact that my k-coefficient goes from ~.98 to ~.02 when I change from a univariate to a multivariate case.
[/quote]


