I have a rather complex model that samples well most of the time. But sometimes one of the chains samples very differently from the others. For example, here is the plot_trace for one of the RVs in one of the sampling runs:
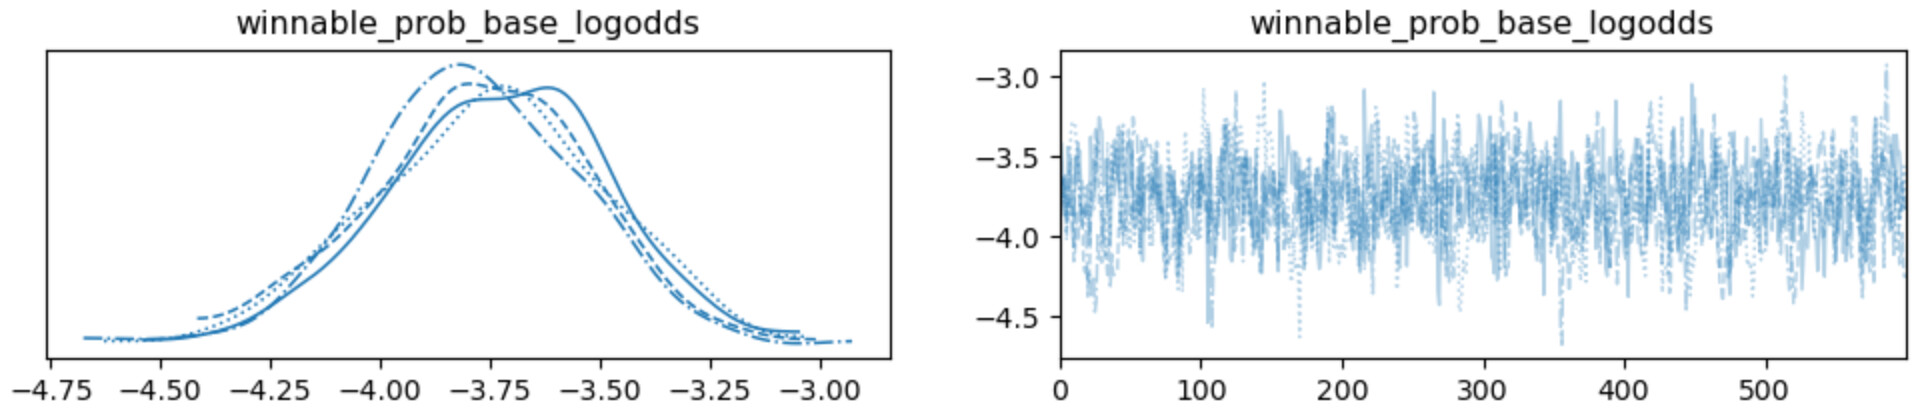
The chains look pretty consistent. \hat{R} is 1.0; ESS is 607 from 2400 samples.
In another sampling run with the same model and the same data, the plot_trace for the same RV looks like this:
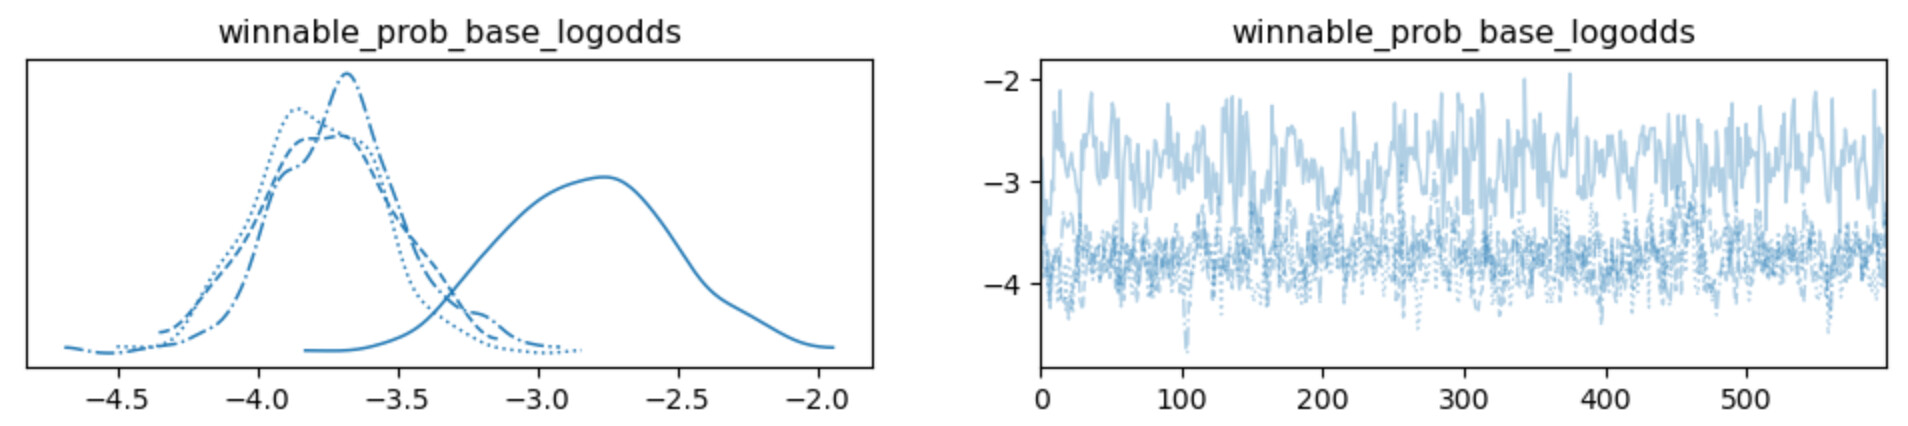
As you can see, one of the chains has a very different idea about the likely value for that RV, shifted more than 1.0 to the right and also with more variance. Unsurprising the sampling statistics are awful. \hat{R} is 1.52; ESS is 7.
Is this common or unusual? How to debug this? How to determine why this is happening, and adjust my model?
And do I need to run a lot more chains to detect this problem? I was under the impression that 4 chains was enough, but perhaps I have been living under a rock, as Christian Luhmann suggests.