Mixture Model Dirichlet

I have a dataset that describes the wealth index of Rwandan housholds: wealth.csv (29.0 KB)
Its shape and distribution is:
image

I am using Pymc3 Mixture Modeling to divide wealth index into 2 separate groups (presumably rich and poor).

with pm.Model() as model:
    hyper_mean = pm.Uniform('hyper_mean', -100, 10)
    hyper_mean1 = pm.Uniform('hyper_mean1', 100, 300)

    hyper_sigma = pm.Uniform('hyper_sigma', 0, 100)
    hyper_sigma1 = pm.Uniform('hyper_sigma1', 0, 150)

    component = pm.Normal.dist(mu=hyper_mean, sd=hyper_sigma)
    component1 = pm.Normal.dist(mu=hyper_mean1, sd=hyper_sigma1)

    w = pm.Dirichlet('w', a=np.array([1, 1]))
    like = pm.Mixture('like', w=w, comp_dists=[component, component1], observed=data)

with model:
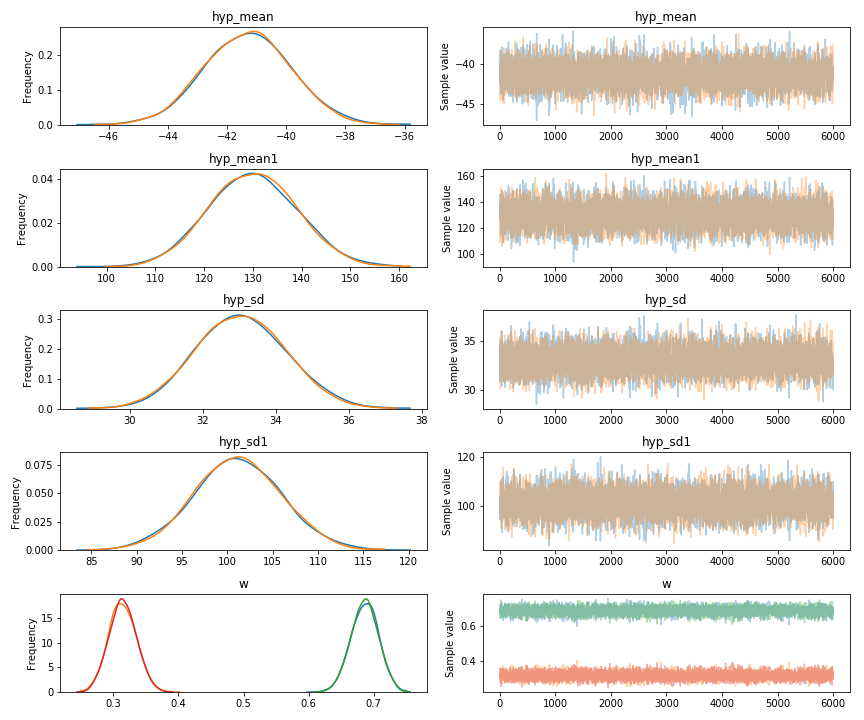
    trace = pm.sample(5000, tune=2500, njobs=1)[1000:]

As I am uncertain about the prior parameters of Rwandan wealth, I (think I) am using non restrictive priors; thus allowing the data to have a strong influence on the posterior.

Resulting in:


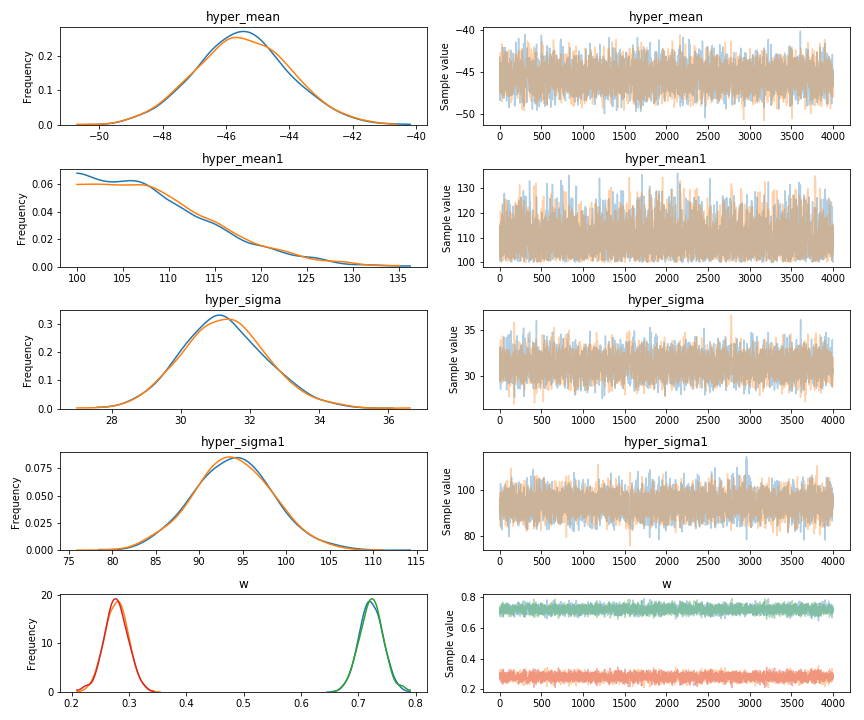
When I visualize posterior values over observed data, the observed data is flatter around the 100-200 wealth index:
image

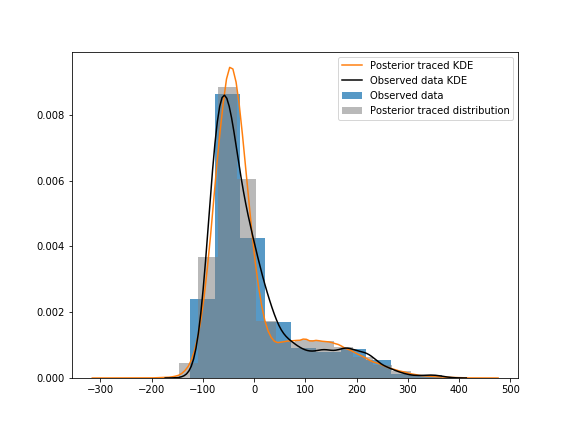
I’ve tried using the Student_T distribution as the components instead of the Normal one, but it gave the model longer tails and a bigger hump around the 100-200 mark.

With the priors being so non restrictive, I would think the data would take over the posterior.

Do you suggest using a different distribution to represent the components, or reparametrize, or do anything else to have the posterior align better?

1 Like

I would suggest changing the prior of hypermean1 - you can see from the shape of the posterior that the value is likely below 100.

Hey Adam,

How is the index computed? This may give us more information about the distribution that should be used!

Also, from personal experience, uniform priors on parameters of a Gaussian are often not adequate. I would try a Normal for the means ( and and Inverse Gamma for the variance (the conjugate priors).

1 Like

Thank you, @rlouf thank you @junpenglao. I changed the prior for hyper_mean1 and used the InverseGamma for the standard deviation. This gave me better results.

But it got me thinking about a difficulty I’ve been having for a while.

Let’s assume I think the standard deviation for the Gaussian is between 80-120. How do I make sure that the InverseGamma hyperparameteres are appropriate and would contain the ‘true’ Gaussian std values?

For example, for InverseGamma alpha=3 and beta=360.

plt.hist(stats.invgamma.rvs(a=3, scale=360, size=data.size, random_state=13), bins=300,normed=True)
sns.kdeplot(stats.invgamma.rvs(a=3, scale=360, size=data.size, random_state=13))
plt.xlim(-50,300)

image

What should I be looking at (mode, mean, the expected value, the visualization) when considering the hyperparameters?

Same goes for the other commonly used distributions for setting hyperparameters:
Exponential
Gamma
Beta
Normal
Cauchy

The hyperparameter distributions build the prior landscape that will allow the data to reflect where the true parameters likely live. So for each of these distributions, what factor (mode, mean, expected value, or visualization) should I be looking at when building the best prior landscape?

That’s a great question - I dont have a definite answer for that, but base on the reading of recent papers like The prior can generally only be understood in the context of the likelihood or
Visualization in Bayesian workflow
, I think the general principle is generate from the prior model a couple of times to make sure the range of the generated data is within a reasonable range. The first difficulty is thus how to define reasonable range (I guess that’s case by case).

If I were to pick one value for to represent it, I would pick the mean or expected value, however, that’s likely not enough as you want to place majority of the volume from the prior within the possible range, and sometimes the expectation is not necessary representative for that.

2 Likes

You say the prior is not restrictive, but the model is structurally restrictive because it only has two components. I would try a Dirichlet Prior Process, which does not fix the number of groups. It could be that there are 3+ groups here, which is not implausible given the nature of the data.

1 Like

Thank you, Chris. Can you please recommend 1 or 2 good sources were I can learn how to implement the Dirichlet Prior Process.

Yes, our very own dev Austin R. has an example in the notebooks directory of the repository.

1 Like