Hi,
I have a fairly simple model that produces posteriors for 5 parameters, however, one of the parameters (pkyrs25) is actually comprised of multiple realizations, i.e, the parameter is an nxm array where each column is the possibly true vector. What I would like is to get weights for each column of the array so that I can identify which array column(s) contribute most to the posterior–or something similar if possible. How could I update the model below so that I can get something like that? Thank you for any help or if you could point me to existing discussions/examples I would greatly appreciate.
with pm.Model() as model:
    # priors on effects
    b1 = pm.Normal("b1", mu=0.0, tau=1.0e-2)
    b2 = pm.Normal("b2", mu=0.0, tau=1.0e-2)
    b3 = pm.Normal('b3', mu=0.0, tau=1.0e-2)
    b4 = pm.LogNormal('b4', mu=0.0, sigma=1.0)
    b5 = pm.Normal('b5', mu=0.0, tau=1.0e-3)

    # background (T0)
    back = pm.Deterministic('Background', np.exp(b1*male + b2*female + b3*logage70))
    # ERR (T1) need to modify pkyrs25 to pkyrs25[:,i]
    # and get weights for each column
    err = pm.Deterministic("ERR", 1 + pkyrs25*b4 * np.exp(bmi30*b5))
    # lambda
    lam = pm.Deterministic("Lambda", py10k * back * err)

    # likelihood
    lik = pm.Poisson('Lik', lam, observed=event_r)
    trace = pm.sample(3000, target_accept=0.96)
If I understand the problem correctly, you want to replace pkyrs25 with a weighted average of its components? This is just a regression problem; all you need to do is replace b4 with a set of m weights and add a matrix multiplication.
pkyrs25_vars = #List of Variable Names
coords = {'pkyrs25':pkyrs25_vars}

with pm.Model(coords=coords) as model:
    # priors on effects
    b1 = pm.Normal("b1", mu=0.0, tau=1.0e-2)
    b2 = pm.Normal("b2", mu=0.0, tau=1.0e-2)
    b3 = pm.Normal('b3', mu=0.0, tau=1.0e-2)
    b4 = pm.Lognormal('b4', mu=0.0, sigma=1.0, dims=['pkyrs25'])
    b5 = pm.Normal('b5', mu=0.0, tau=1.0e-3)

    # background (T0)
    back = pm.Deterministic('Background', np.exp(b1*male + b2*female + b3*logage70))
    # ERR (T1) need to modify pkyrs25 to pkyrs25[:,i]
    # and get weights for each column
    err = pm.Deterministic("ERR", 1 + tt.dot(pkyrs25, b4) * np.exp(bmi30 * b5))
    # lambda
    lam = pm.Deterministic("Lambda", py10k * back * err)

    # likelihood
    lik = pm.Poisson('Lik', lam, observed=event_r)
    trace = pm.sample(3000, target_accept=0.96)
If you needed additional restrictions on the b4 weights you could play around with the prior, but this will give you the relative importance of each factor within pkyrs25.
Hi and thank you for the clarification. Yes, pkyrs25 is a variable. You can think of pkyrs25 as the number cigarette packs smoked by each individual in the cohort. However, there is a problem in that the “true” number of packs is not know due to bias/uncertainties like misreporting, lying, etc…so instead of a single vector (Nx1) we have multiple vectors (NxM) where each different vector incorporates the bias or uncertainty to a different degree. The hope was to possibly re-parameterize or update the initial pmyc model somehow so that we could incorporate the M vectors to determine which pkyrs25 vector(s) are the most “likely” to be to correct vector. One thought was to create a distribution of column indices 1-M which could then be sampled to index the columns of pkyrs25 and we’d end up with a posterior informing us of which columns of pkyrs25 were sampled the most to get the model fit. It may not be possible to do something like that, but I wanted to explore it a bit.
This might be similar to a BMA-type approach where we just create M different models each based on different vector of pkyrs25 and then use stacking or something to compare the different “models” using a metric like WAIC. However, in theory the model form doesn’t change, only the pkyrs25 vector changes. So I didn’t know if that was the appropriate method.
Thanks for the interest and I apologize for lack of clarity or confusion on my part. Its all much appreciated.
At least in my field, when you have several covariates measuring the same thing, people typically run each model separately and report all the results in one table, then as you say, compare WAIC or (more often) r2.
Another option is to combine them all into a single index variable, via PCA for example, and examine the factor loadings to see if any one variable is more informative than the others (for example if 80+% of explained variance comes from one variable, just dump the rest).
What prevents you from putting them all into the model and jointly estimating them is that the effect estimates of each variable won’t be identified due to the correlation between them. If you think that all the covariance between them comes from a common shared source (“true smoking habit”), you could try to estimate each of your pkyrs25s as a function of a latent variable. In that case, the implied causal model would be something like this:
The power of Bayesian approach and PPL is that it’s easy to estimate a latent variable like that – just put a prior on it. I don’t know if this causal model is reasonable, though. From my (uninformed) intuition, age and gender, which are in “other stuff”, also affect “smoking habit”, so you would need to think about how to control for that to achieve identification.
It sounds like you want a to figure out which of the vectors in pkyrs25 is “the correct one”. Is that correct? If so, you can do something like this
import pymc3 as pm
import numpy as np
import arviz as az
import matplotlib.pyplot as plt
# observed data
obs = [1,2,3,4]
with pm.Model() as model:
# set of possible true vectors
possible_vectors = pm.Data('possible_vectors',
value=[ [1.1,2.1,3.1,4.1],
[1,1,1,3],
[2,2,2,3],
[1,1,4,4,]
]
)
# D-C
p = pm.Dirichlet("p", a=np.array([1.0, 1.0, 1.0]))
selector = pm.Categorical('selector', p=p)
# vector is probabilistically selected
# from among the candidates
vector = possible_vectors[selector]
# likelihood
like = pm.Normal('like', vector, observed=obs)
trace = pm.sample(return_inferencedata=True)
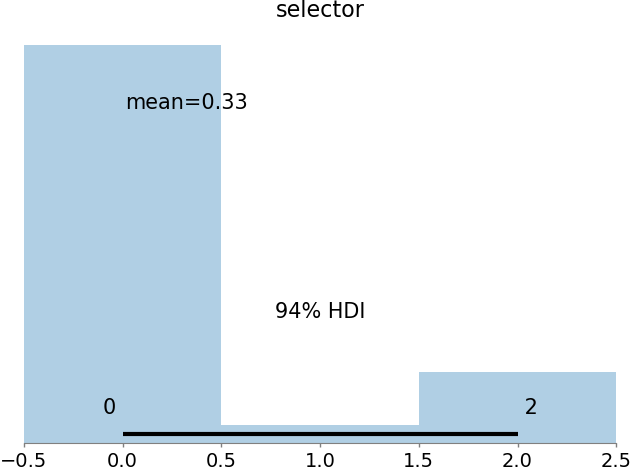
az.plot_posterior(trace, var_names=['selector'])
plt.show()
That will give you something like this:
But I wouldn’t actually recommend doing this. If you have idea about how the observed data might be linked to unobserved variables (e.g., the bias you mention), it probably makes more sense to make an actual measurement model instead of sort of “hard coding” several possible data sets.
Ahh, I see. That’s fairly straight-forward. I had tried something similar but I was having some indexing errors because of object type. Thank you. We’re just beginning to move some of our approaches to Bayesian so the responses have been informative and useful. Knowledgeable community too. Much obliged
An issue we often have to deal with is that the simulations that produce the realizations are often “black-box” to us and we don’t have a good understanding of how they were generated. In the past folks have just averaged across realizations to produce a mean and then just fit a model using an MLE approach. More recent approaches involve trying to more appropriately incorporate the uncertainty evinced by the separate realizations. Hence the interest in identifying the vectors that seem to be the most “correct” ones. But the overall goal is actually to produce some type of weighted average w/ HDIs where the most “correct” models/realizations have the most weight. This attracted us to BMA-type approaches for M-closed problems. But I understand that PyMC doesn’t actually offer a full BMA approach. In any case, I’ve been searching for threads on this topic. If you know of a good source of info on this type of problem please point me in the right direction. Also any comments or insights appreciated–as always.