I’m trying to plot multiple Gaussian processes (without the samples) in one figure via pm.gp.util.plot_gp_dist. However, I have problems with the transparency, especially of the credible intervals:
By adjusting fill_alpha it gets a bit better (here, I set it to 0.2):
Still, it is not perfect. E.g. the credible interval of the green GP “throws a shadow” on the red line. Does anybody had problems like this and have a hint for me?
Right now this function increments through a color map (looks best with white -> single color set up) as a function of the samples percentiles. Instead I think you’d have to vary alpha to get this to look nice.
Maybe something like this?
percs = np.linspace(51, 99, 40)
alphas = (percs - np.min(percs)) / (np.max(percs) - np.min(percs))
for i, p in enumerate(percs[::-1]):
    upper = np.percentile(samples, p, axis=1)
    lower = np.percentile(samples, 100 - p, axis=1)
    ax.fill_between(x, upper, lower, color="blue", alpha=alphas[i])
Check out the code around line 153 here.
2 Likes
@bwengals thanks a lot for your solution which helps a lot!
I implemented your code, then it looks like this:
For still having the color gradients, I now adapted your solution a bit:
cmap = plt.get_cmap(palette)
percs_color = np.linspace(51, 99, 20)
percs_alpha = np.linspace(51, 99, 20)
colors = (percs_color - np.min(percs_color)) / (np.max(percs_color) - np.min(percs_color))
samples = samples.T
x = x.flatten()
alphas = (percs_alpha - np.min(percs_alpha)) / (np.max(percs_alpha) - np.min(percs_alpha))
for i, p in enumerate(percs_color[::-1]):
    upper = np.percentile(samples, p, axis=1)
    lower = np.percentile(samples, 100 - p, axis=1)
    color_val = colors[i]
    ax.fill_between(x, upper, lower, color=cmap(color_val), alpha=alphas[i], **fill_kwargs)
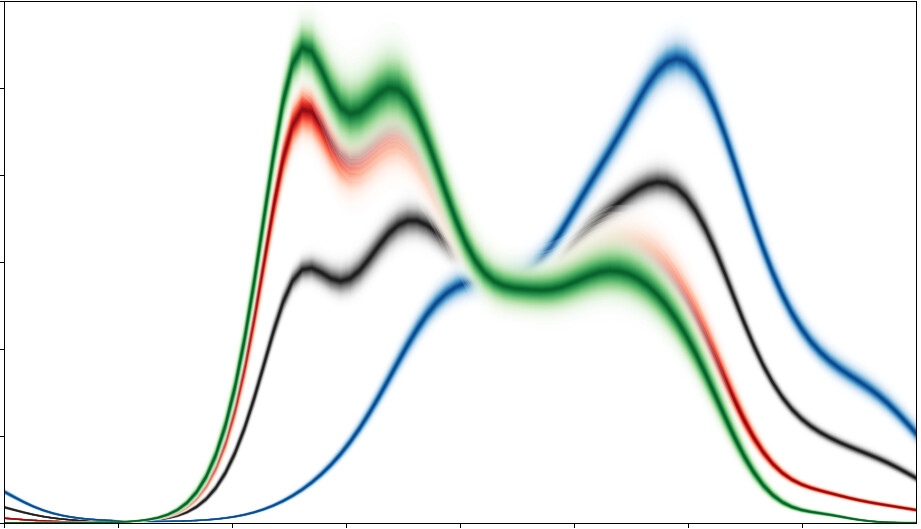
Then we do have a color as well as an alpha gradient which let it looks like this:
So now it’s way better than in the beginning. Still, I’m not 100 percent happy. I guess I need to play around with the values of percs_alpha and percs_color to get a better result.
1 Like