I have the following code:
#std_range = df.std_range.values[:, np.newaxis]
#shared(std_range, broadcastable=(False, True))
#x1_shift = ppc['obs'][:K]
x1_shift = shared(df['x1'].values[:, np.newaxis], broadcastable=(False, True))
x2obs = df['x2'].values[:, np.newaxis]
#Model for x2
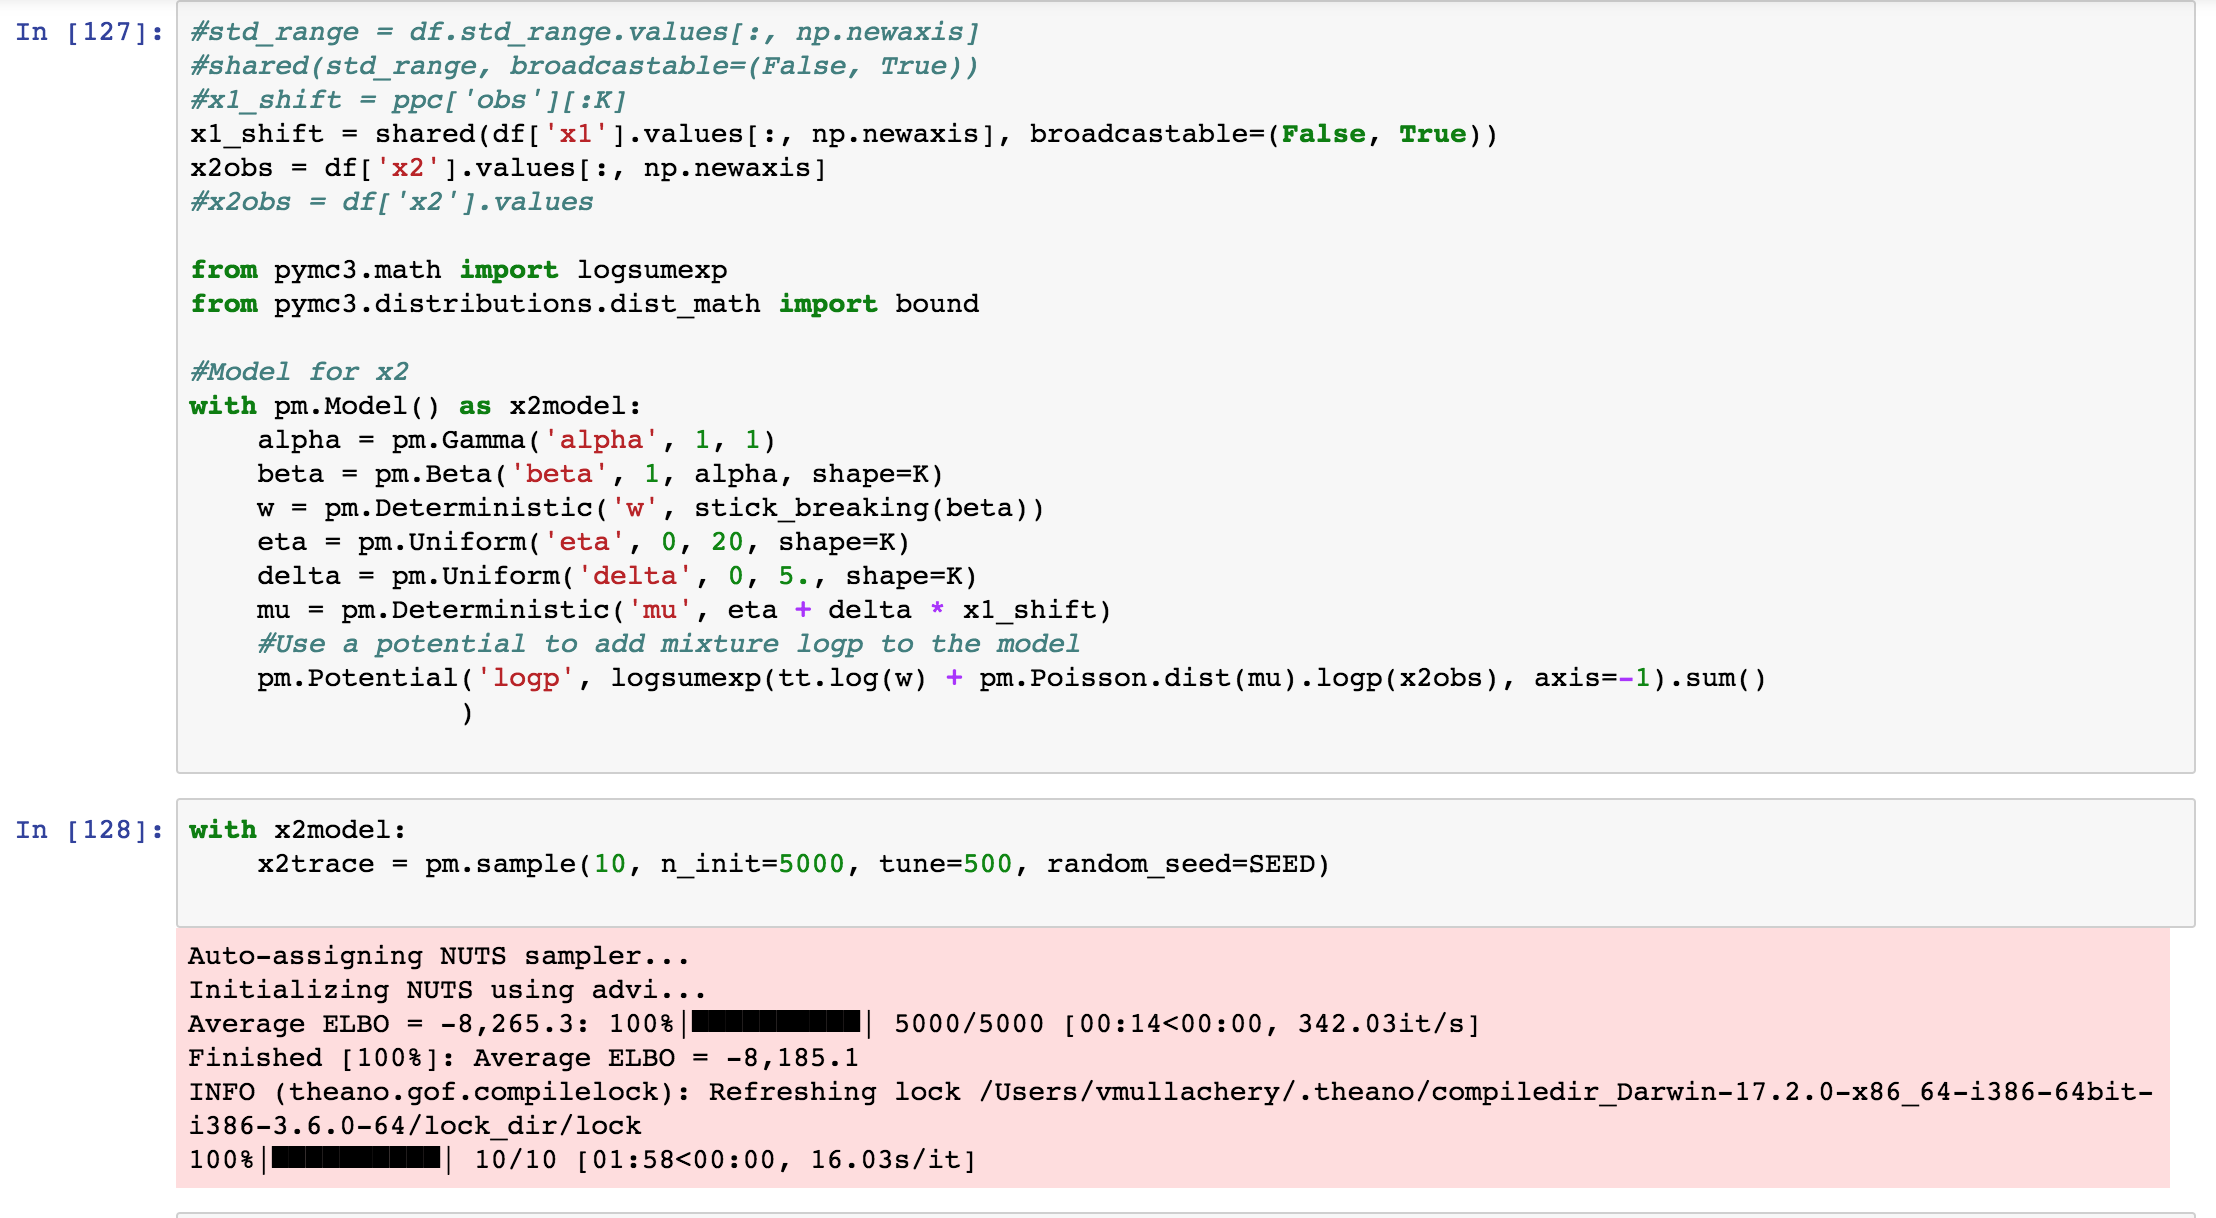
with pm.Model() as x2model:
alpha = pm.Gamma('alpha', 1, 1)
beta = pm.Beta('beta', 1, alpha, shape=K)
w = pm.Deterministic('w', stick_breaking(beta))
#a = pm.Uniform('a', 0, 50, shape=K)
#b = pm.Uniform('b', 0, 50, shape=K)
eta = pm.Uniform('eta', 0, 20, shape=K)
delta = pm.Uniform('delta', 0, 10., shape=K)
mu = pm.Deterministic('mu', eta + delta * x1_shift)
bp = [pm.Bound(pm.Poisson, lower=1, upper=70).dist(mu=mu[i]) for i in range(K)]
#x = pm.Mixture('obs', w, pm.Poisson.dist(mu), observed=df['x1'].values)
x2 = pm.Mixture('obsx2', w, bp, observed=x2obs)
with x2model:
    x2trace = pm.sample(1000, step=pm.Metropolis(), n_init=1000, random_seed=SEED)
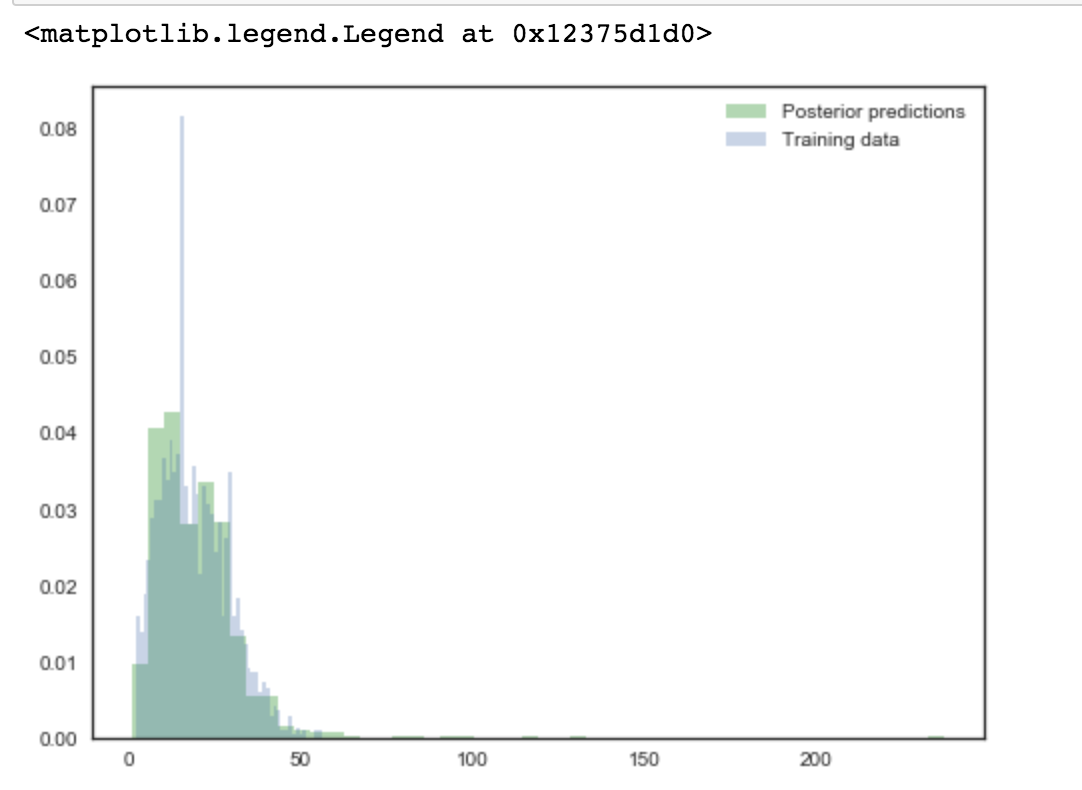
And now sample_ppc breaks:
with x2model:
    x2ppc = pm.sample_ppc(x2trace, 1000)

fig, ax = plt.subplots(figsize=(8,6))
ax.hist(x2ppc['obsx2'], bins=50, normed=True, alpha=0.3, color='green', label='Posterior predictions')
ax.hist(df['x2'], bins=50, normed=True, alpha=0.3, label='Training data')
ax.legend(loc=1)
The error:
---------------------------------------------------------------------------
AttributeError                            Traceback (most recent call last)
/Users/vmullachery/anaconda/envs/dl3.6/lib/python3.6/site-packages/pymc3/distributions/mixture.py in _comp_samples(self, point, size, repeat)
    101         try:
--> 102             samples = self.comp_dists.random(point=point, size=size, repeat=repeat)
    103         except AttributeError:

AttributeError: 'list' object has no attribute 'random'

During handling of the above exception, another exception occurred:

ValueError                                Traceback (most recent call last)
<ipython-input-38-802c9cc44cd5> in <module>()
      1 with x2model:
----> 2     x2ppc = pm.sample_ppc(x2trace, 1000)
      3
      4 fig, ax = plt.subplots(figsize=(8,6))
      5 ax.hist(x2ppc['obsx2'], bins=50, normed=True, alpha=0.3, color='green', label='Posterior predictions')

/Users/vmullachery/anaconda/envs/dl3.6/lib/python3.6/site-packages/pymc3/sampling.py in sample_ppc(trace, samples, model, vars, size, random_seed, progressbar)
    389         for var in vars:
    390             ppc[var.name].append(var.distribution.random(point=param,
--> 391                                                          size=size))
    392
    393     return {k: np.asarray(v) for k, v in ppc.items()}

/Users/vmullachery/anaconda/envs/dl3.6/lib/python3.6/site-packages/pymc3/distributions/mixture.py in random(self, point, size, repeat)
    131                                      dist_shape=self.shape,
    132                                      size=size).squeeze()
--> 133         comp_samples = self._comp_samples(point=point, size=size, repeat=repeat)
    134
    135         if comp_samples.ndim > 1:

/Users/vmullachery/anaconda/envs/dl3.6/lib/python3.6/site-packages/pymc3/distributions/mixture.py in _comp_samples(self, point, size, repeat)
    103         except AttributeError:
    104             samples = np.column_stack([comp_dist.random(point=point, size=size, repeat=repeat)
--> 105                                        for comp_dist in self.comp_dists])
    106
    107         return np.squeeze(samples)

/Users/vmullachery/anaconda/envs/dl3.6/lib/python3.6/site-packages/pymc3/distributions/mixture.py in <listcomp>(.0)
    103         except AttributeError:
    104             samples = np.column_stack([comp_dist.random(point=point, size=size, repeat=repeat)
--> 105                                        for comp_dist in self.comp_dists])
    106
    107         return np.squeeze(samples)

/Users/vmullachery/anaconda/envs/dl3.6/lib/python3.6/site-packages/pymc3/distributions/continuous.py in random(self, point, size, repeat)
   1183         return generate_samples(self._random, lower, upper, point,
   1184                                 dist_shape=self.shape,
-> 1185                                 size=size)
   1186
   1187     def logp(self, value):

/Users/vmullachery/anaconda/envs/dl3.6/lib/python3.6/site-packages/pymc3/distributions/distribution.py in generate_samples(generator, *args, **kwargs)
    336             samples = generator(size=size, *args, **kwargs)
    337         else:
--> 338             samples = generator(size=1, *args, **kwargs)
    339     else:
    340         if size is not None:

/Users/vmullachery/anaconda/envs/dl3.6/lib/python3.6/site-packages/pymc3/distributions/continuous.py in _random(self, lower, upper, point, size)
   1171             sample = self.dist.random(point=point, size=n)
   1172             select = sample[np.logical_and(sample > lower, sample <= upper)]
-> 1173             samples[i:(i + len(select))] = select[:]
   1174             i += len(select)
   1175             n -= len(select)

ValueError: could not broadcast input array from shape (12) into shape (1)