Question of sampling result

I am new to learning MCMC and I have a nonlinear model like this:

Takano_model_1 = pm.Model()
with Takano_model_1:
## Priors
A_f = pm.Bound(pm.Normal, lower=0.0)(“A_f”,mu = 3.8671, sigma = 3.867110)
A_r = pm.Bound(pm.Normal, lower=0.0)(“A_r”,mu = 1.1635, sigma = 1.1635
10)
A_CO2 = pm.Bound(pm.Normal, lower=0.0)(“A_CO2”,mu = 2.5027, sigma = 2.502710)
A_H2O = pm.Bound(pm.Normal, lower=0.0)(“A_H2O”,mu = 5.5128, sigma = 5.5128
10)
### Activation energy (unit:J/mol)
Ea_f = pm.Bound(pm.Normal, lower=0.0)(“Ea_f”,mu = 2.2768, sigma = 2.276810)
Ea_r = pm.Bound(pm.Normal, lower=0.0)(“Ea_r”,mu = 1.1445, sigma = 1.1445
10)
Ea_CO2 = pm.Bound(pm.Normal, upper=0.0)(“Ea_CO2”,mu = -3.2333, sigma = 3.233310)
Ea_H2O = pm.Bound(pm.Normal, lower=0.0)(“Ea_H2O”,mu = 7.7608, sigma = 7.7608
10)
sigma = pm.HalfNormal(‘sigma’,sd = 0.0003)

k_f = A_f * 1.0E02 * (math.e ** (- Ea_f * 1.0E04 / R / T_Bottom))
k_r = A_r * 1.0E08 * (math.e ** (- Ea_r * 1.0E05 / R / T_Bottom))
K_CO2 = A_CO2 * 1.0E-05 * (math.e ** (- Ea_CO2 * 1.0E04 / R / T_Bottom))
K_H2O = A_H2O * 1.0E07 * (math.e ** (- Ea_H2O * 1.0E04 / R / T_Bottom))
r_CH4_obs = k_f * (K_CO2 * p_CO2_in * p_H2_in ** 0.5) / ((1 + K_CO2 * p_CO2_in) ** 2) - k_r * (K_H2O * p_CH4_in ** 2 * p_H2O_in) / ((1 + K_H2O ** 2 * p_H2O_in) ** 2)

##Likehood function
r_CH4_likehood = pm.Normal('r_CH4_likehood',mu = r_CH4_obs, sd = sigma, observed = r0_CH4)

Due to the conditions of the chemical equation, bound is applied to the prior distribution.
But I’m confused about the posterior traceplot:


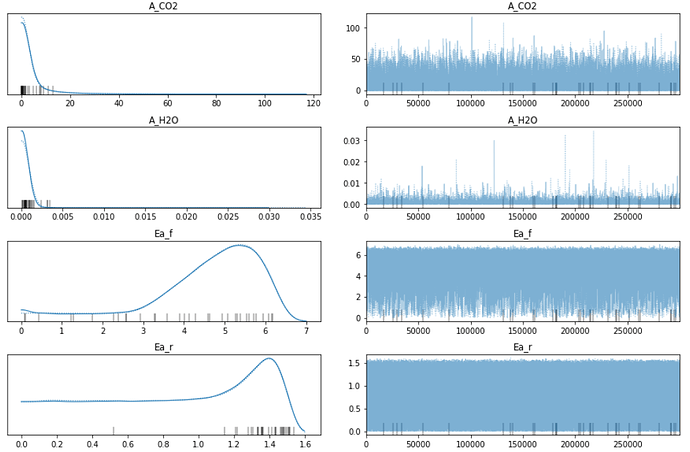
It seems that the resulting distribution around 0 is odd. The posterior should have been a Normal Distribution, but A_CO2 and A_H2O look like Halfnormal distribution. And it seems that the distribution of Ea_r is started from 0, many sampling results distributed at 0, it looks like that the samlping less than zero is cut.
So my question is whether the function of bound is to directly remove the result below 0?
How can I explain the result of Ea_r, which is odd around zero?
And Is the sampling result of this MCMC reliable?

Thanks!
So let’s go by parts MCMC and PyMC3 is a smart sampler that uses your parameter priors to build Markov chains that contain your posterior distributions for each parameter.

This being said, you can always update your priors for example for Ea_r you can use in a second step something like Uniform(3,7) instead of your initial prior… Why I am saying this, for you to force the sampler to draw samples in a reduced region.

In order to check if the mcmc samples have converged you can always plot the autocorrelation (good case is near 0) something like this:

pm.plot_autocorr(trace)

Hope my advice helps you…

My understanding of how pymc3 constructs bounded variables is that it simply prevents the sampler/chain from ever exploring outside the bounding interval. In your example, you have placed lower bounds of 0.0 on both A_CO2 and A_H2O. However, it’s pretty clear that the model and the data are encouraging the sampler to head toward zero (the marginal posteriors for both of these variables are stacked up right at 0.0). Once the sampler gets there, it bumps up against the bound you have provided and cannot explore smaller values. The conflict between the model/data/likelihood on the one hand and the bound on the other hand is likely what is causing the divergences (the tick marks on the x-axis) you see near A_CO2=0 and A_H2O=0.

So to answer a couple of your questions directly:

…bound is applied to the prior distribution.

Bounds are applied to variables, not just the priors associated with those variables.

…is the function of bound is to directly remove the result below 0?

No. The function is the prevent the sampler from every exploring values that are less than zero. The chains don’t sample negative values that later get “removed”. Negative values are never sampled in the first place.

How can I explain the result of Ea_r, which is odd around zero?

Given the difficulties associated with A_CO2 and A_H2O, the entire posterior interpretation of the entire posterior is probably a bit suspect. I would focus dealing with A_CO2 and A_H2O, their bounds, and the divergences they seem to be producing before worrying about the other variables.

2 Likes