Hi,
I’ve imported the same notebook into Google Colab and run it there and when I plot anything from pymc3 the plots are different. On my local machine I see a combined plot but on Google Colab it seems like it plots each variable/node separately.
Local:

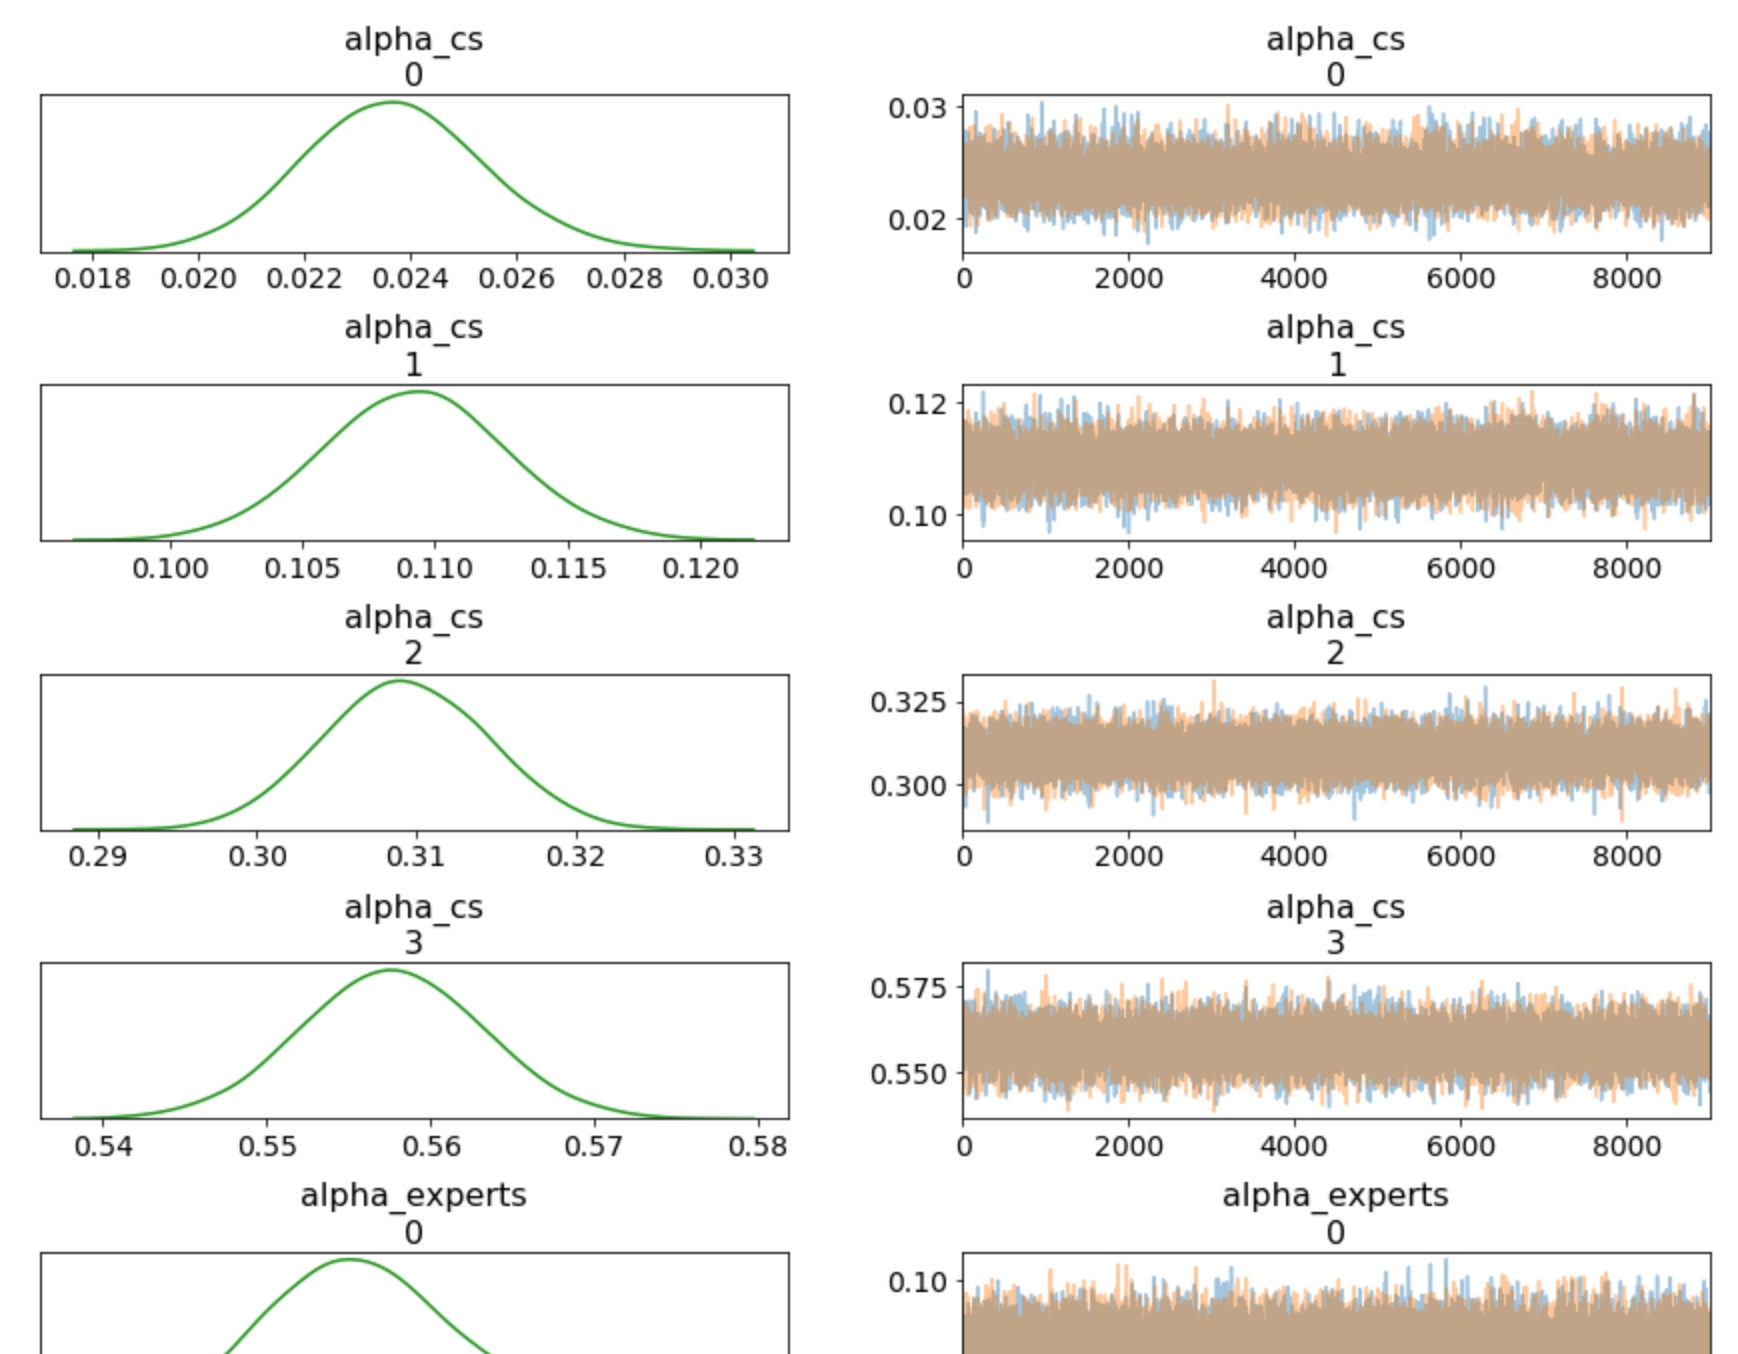
Google Colab:
How do I get the “combined” plot on Google Colab?
