Hi all!
As a big Stan and brms user, I am really enjoying learning to fit Bayesian models in Python with the PyMC ecosystem.
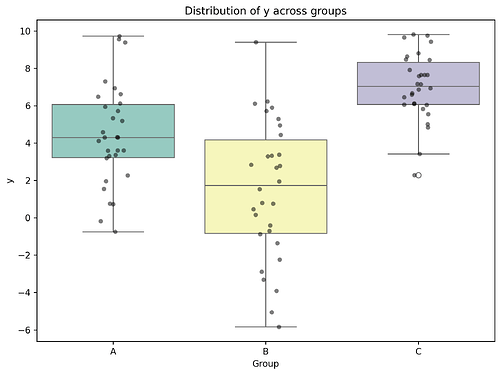
While attempting to refit models from my own work in bambi, I ran into some trouble plotting posterior expectations and 95% HDIs from an ANOVA model. Here’s a simple simulation to demonstrate the issue
import arviz as az
import bambi as bmb
import numpy as np
import pandas as pd
import matplotlib.pyplot as plt
import seaborn as sns

# Simulate data
np.random.seed(42)
x = ['A', 'B', 'C']
yA = np.random.normal(loc=5, scale=3, size=30)
yB = np.random.normal(loc=2, scale=4, size=30)
yC = np.random.normal(loc=7, scale=1.8, size=30)

# Create a DataFrame
data = pd.DataFrame({
    'y': np.concatenate([yA, yB, yC]),
    'group': np.repeat(x, repeats=30)
})
data['group'] = data['group'].astype('category')

# Plot the data
plt.figure(figsize=(8, 6))
sns.boxplot(x='group', y='y', data=data, palette='Set3')
sns.stripplot(x='group', y='y', data=data, color='black', alpha=0.5, jitter=True)
plt.title('Distribution of y across groups')
plt.xlabel('Group')
plt.ylabel('y')
plt.show()
# Fit a Bayesian ANOVA model using Bambi
model = bmb.Model('y ~ group', data)
idata = model.fit()

preds = model.predict(idata, kind="response_params", inplace=False)
y_mu = az.extract(preds["posterior"])["mu"].values
group = data.loc[:, "group"].values
Now I want to use az.plot_hdi() to plot the expectation of the posterior distribution that I extracted (in preds above).
Following the documention for arviz, I first tried:
az.plot_hdi(x=group, y=y_mu.T)

#UFuncTypeError: ufunc 'multiply' did not contain a loop with signature matching types (dtype('<U1'), dtype('float64')) -> None
It turns out that az.plot_hdi has a parameter called smooth that is True by default. In this case, the function attempts to interpolate across all x, which is not possible for numpy to do when x is categorical. Setting smooth to False works around the error, but does not produce the plot I’d expect it to (interpolating the HDI across groups instead of plotting, say, segments for the HDI region):
az.plot_hdi(x=group, y=y_mu.T, smooth=False)
Am I missing something with respect to how az.plot_hdi() is intended to behave? The documentation doesn’t seem to suggest the function should only work if x is numeric, but that seems to be the behavior? Perhaps there’s a plot_kwarg that I should be passing through to matplotlib to get a more fitted ANOVA like plot?
If this is not expected, I am happy to try and figure out a solution and contribute to the repo. I wanted to open up a discussion before a github issue though.


