Hello
I have some data comprising growth curves, and I’d like to test if they’re different from each other. Some (simulated) data looks like this:

There are two individuals (red and blue), from which 10 repeats are measured, at 12 time points.
I’ve set the model up as follows:
with pm.Model():

    # Model 1: Single, shared, growth curve
    a_1 = pm.Normal("a_1", 1, 1)
    b_1 = pm.Normal("b_1", 1, 1)
    d_1 = pm.Normal("d_1", 1, 0.5)
    mu_1 = sigmoid(x, a_1, b_1, 0, d_1)

    # Model 2: Independent growth curves
    a_2 = pm.Normal("a_2", 1, 1, shape=2)
    b_2 = pm.Normal("b_2", 1, 1, shape=2)
    d_2 = pm.Normal("d_2", 1, 0.5, shape=2)
    mu_2 = sigmoid(x, a_2[i], b_2[i], 0, d_2[i])

    # Choose between mu_1 and mu_2
    p_mu = pm.Beta("p_mu", 1, 1)
    m = pm.Bernoulli("m", p_mu)  # model index parameter

    # Likelihood
    sigma = pm.Exponential("sigma", 1)
    pm.Normal("lik", mu_1 * (1 - m) + mu_2 * m, sigma, observed=y)
And then the strength of the preference between model 1 and model 2 comes down to the value of m.
I think this is fine in theory, but in practice a single chain doesn’t explore different values of m:
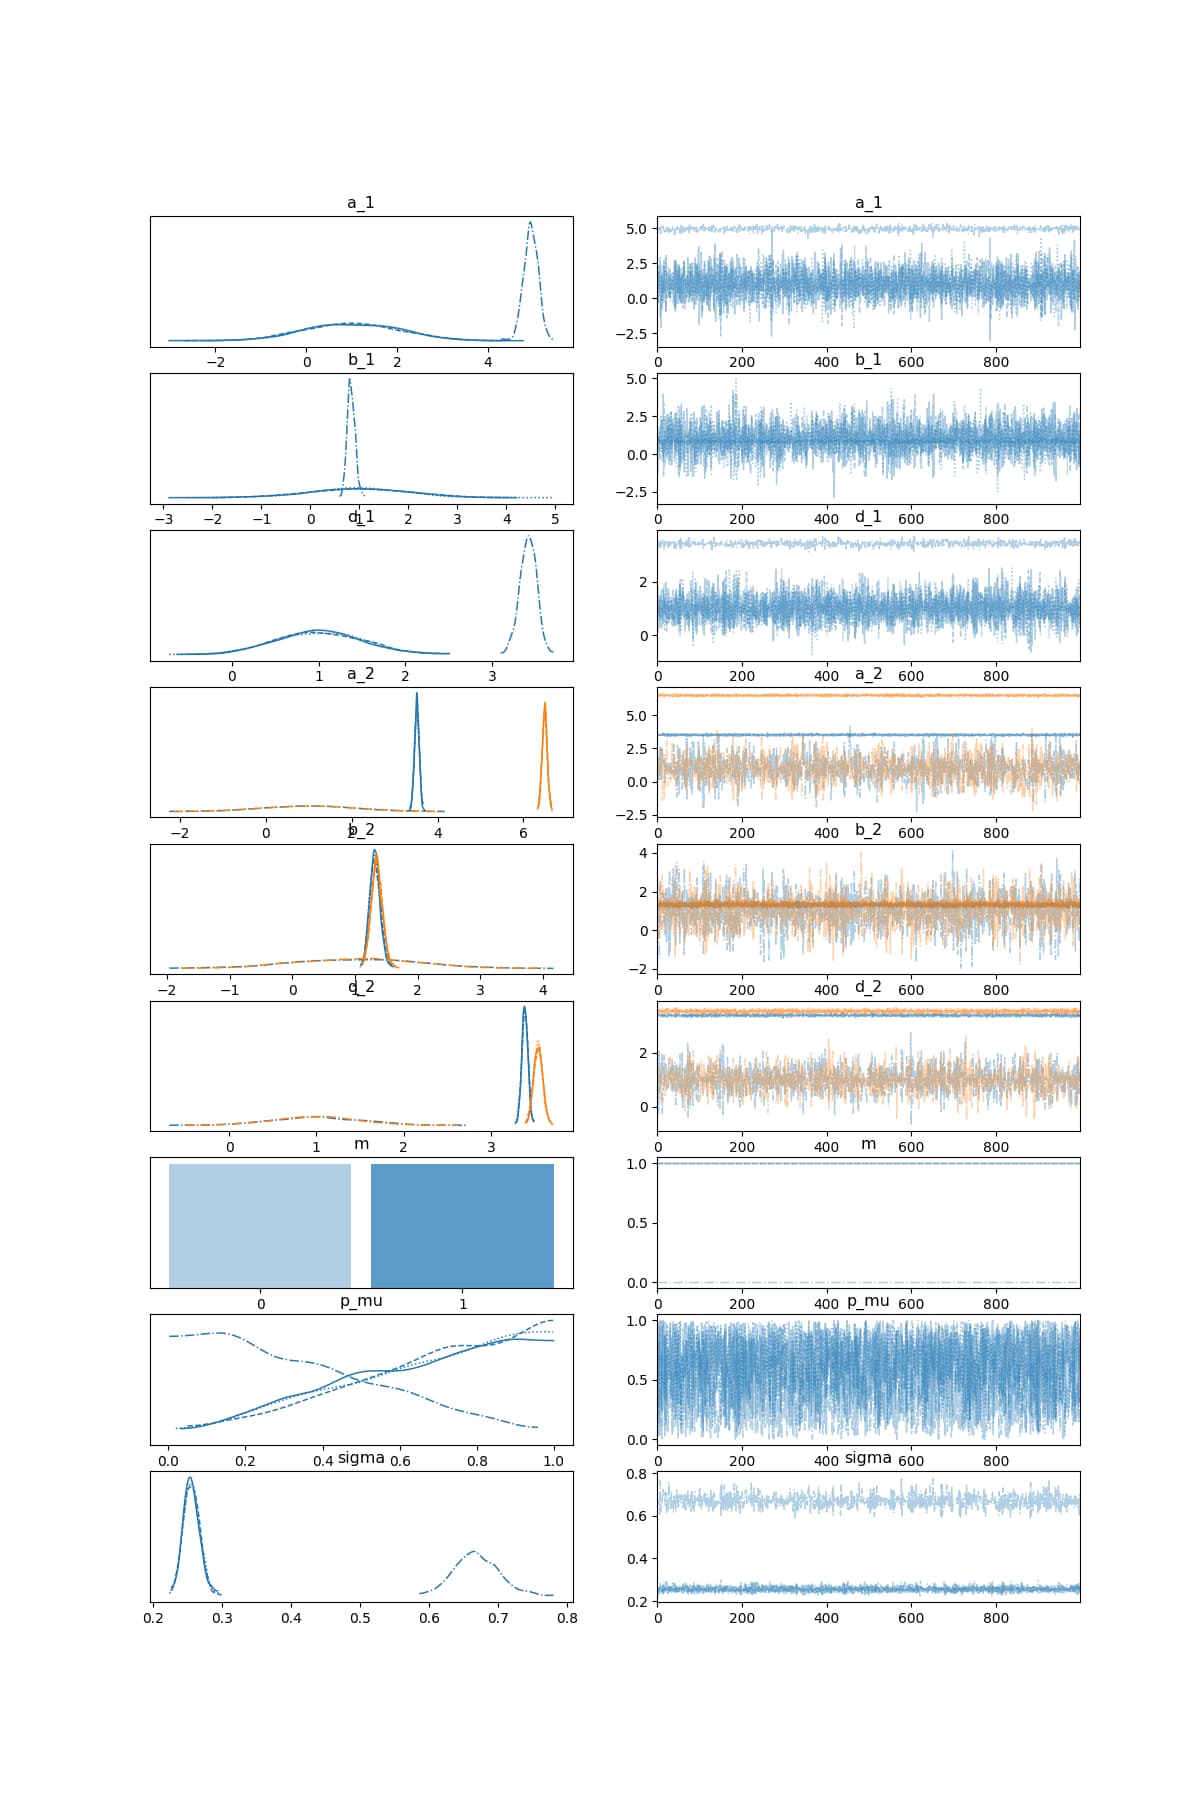
One chain has settled on m=0, whilst the other three have settled on m=1.
Are there approaches to help exploration within chains?
Thanks a lot
David