import matplotlib.pyplot as plt
import numpy as np
The function bellow serves to generat random values for a given mean and amount of samples n
def generate_random_values(n, mean, low, high):

    # Generate initial random values using normal distribution
    values = np.random.normal(loc=mean, scale=1.0, size=n)

    # Clip values to the specified range
    values = np.clip(values, low, high)

    return values
function which is used to generate seeds
def generate_seeds_matrix(rows_seed, cols_seed):

    low = 6
    high = 1e7
    return np.random.randint(low, high, size=(rows_seed, cols_seed))
following function bellow is employed to generate X inputs
def generate_X(cols_seed):

    appended_array = np.array([])
    n_samples = np.array([10, 50, 12, 30, 4, 45])
    mean      = np.random.normal(loc=0.7, scale=1.0, size=np.size(n_samples))#np.array([0.75, 0.60, 0.80, 0.70, 0.5, 0.55])
    low       = np.array([0.30, 0.25, 0.55, 0.17, 0.35, 0.30])
    high       = np.array([1.2, 1.7, 2.2, 1.2, 1.9, 2])
    for i, _ in enumerate(n_samples):
        array = generate_random_values(n_samples[i], mean[i], low[i], high[i])
        if i ==0 or i==2:
            appended_array = np.concatenate((appended_array, array))
        else:
            #array = np.full((n_samples[i]), array[-1])
            array = np.full((n_samples[i]), 0.1*array)
            appended_array = np.concatenate((appended_array, array))
    return appended_array
last function serves to simulate observed values
def y_observed(seed_matrix, rows_seed):

    X_list = [generate_X(seed_i) for seed_i in seed_matrix]
    X = np.array(X_list)
    slopes =  np.random.uniform(-0.5, 0.7, rows_seed)
    alpha  = 1.5
    return np.dot(slopes, np.log(X)) + alpha
part of the script bellow is used to display X, Y observed and distribution of observed data
#########################
np.random.seed(123654)
rows_seed = 3 # Xi inputs
cols_seed = 6 # fixed amount of mixed arrays, hardcoded


seed_matrix = generate_seeds_matrix(rows_seed, cols_seed)
for seed_i in (seed_matrix):
    plt.plot(generate_X(seed_i))
plt.title("generated X")
plt.show()
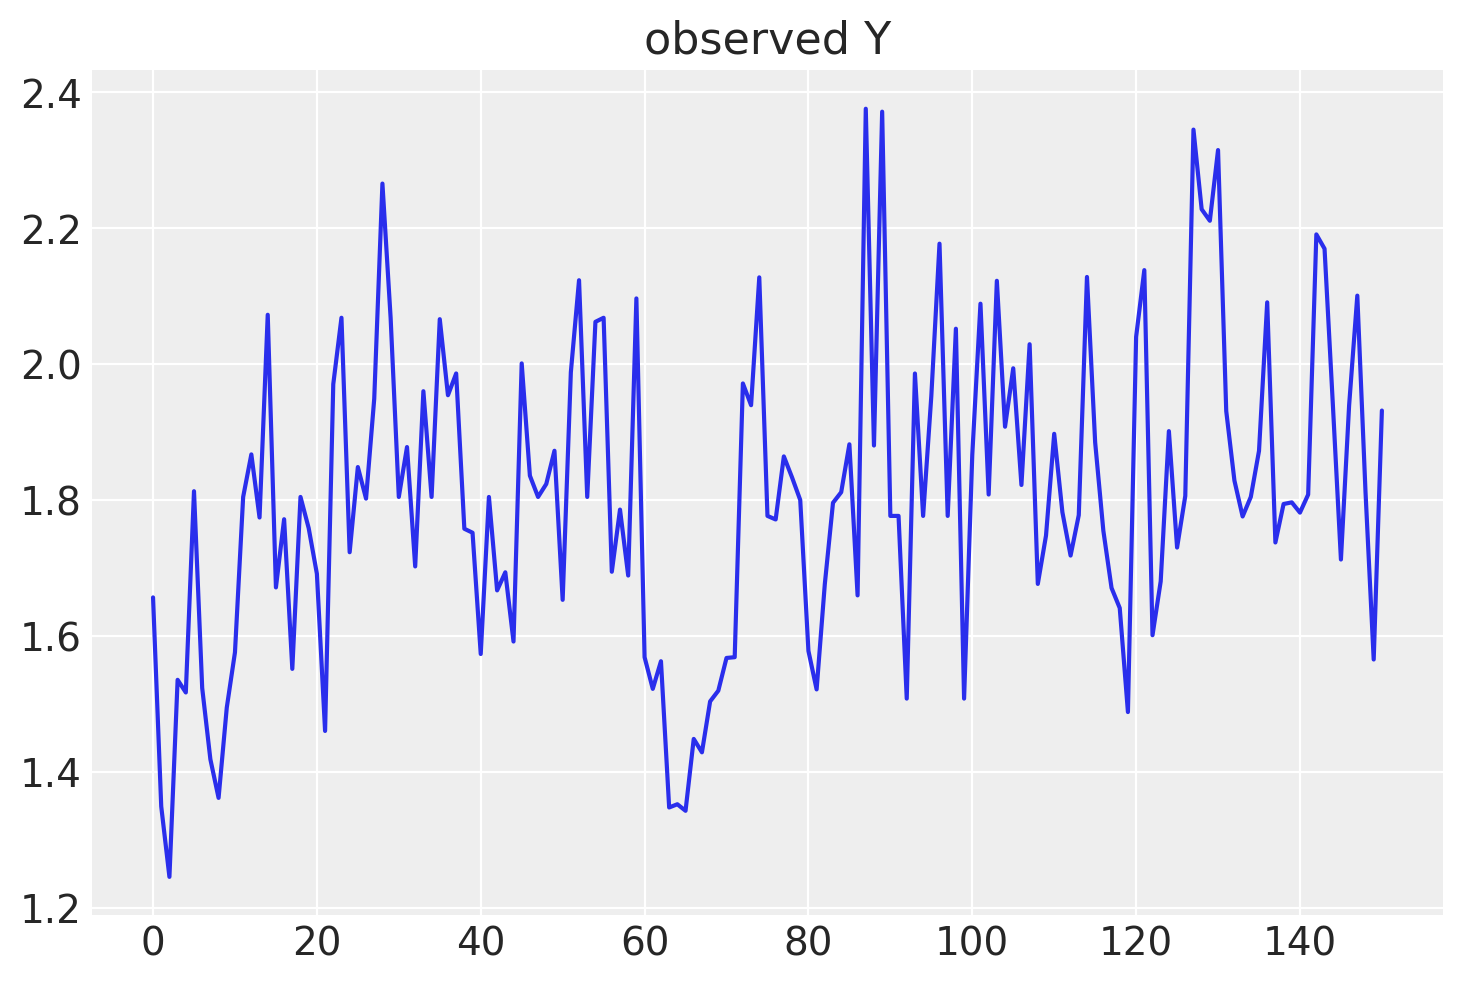
y = y_observed(seed_matrix, rows_seed)
plt.plot(y)
plt.title("observed Y")
plt.show()
az.plot_kde(y)
plt.title("observed Y dist")
plt.show()
The target is to perform the regression with mixtures of gaussians applied on the equation
y = alpha + beta1*x1 + beta2*x2 + beta3*x3
the worst thing is I even dont know how to start to create the model. As I mentioned before the multilinear robuts and non robust regression I was able to follow and apply it but with this approach I dont know, therfore I would like to kindly ask for your guidance and support.