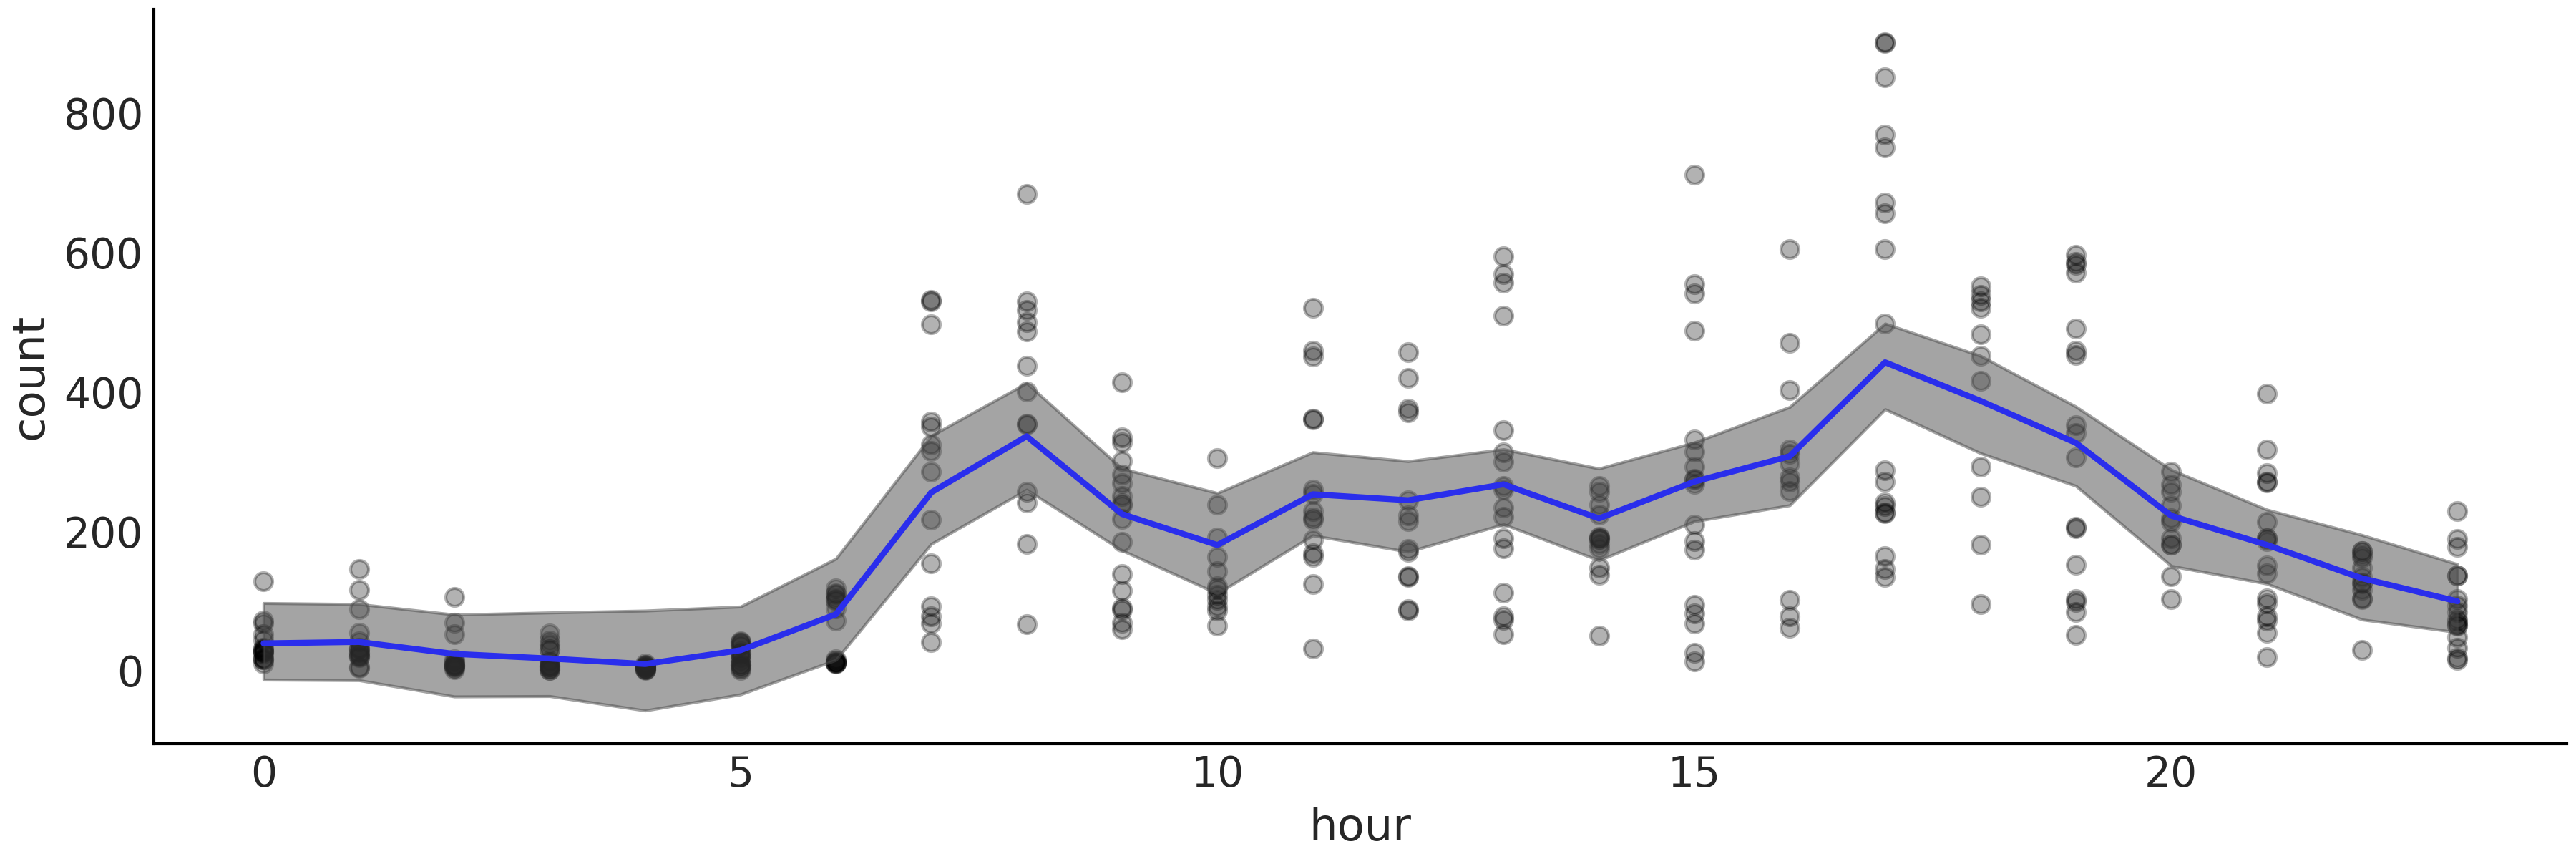
Hi, I am learning about how to use pymc-bart using example in here. I modified the sample code a little bit to reflect the latest pymc and pymc-bart version. My codes are below
data = pd.read_csv("bikes_hour.csv")
data = data[::100]
data.sort_values(by='hour', inplace=True)
data.hour.values.astype(float)

X = np.atleast_2d(data["hour"]).T
Y = data["count"]

with pm.Model() as bart_g:
    σ = pm.HalfNormal('σ', Y.std())
    μ = pmb.BART('μ', X, Y, m=50)
    y = pm.Normal('y', μ, σ, observed=Y)
    trace = pm.sample(2000, chains=4, return_inferencedata=True)


posterior = trace.posterior.stack(samples=("chain", "draw"))

_, ax = plt.subplots(1, 1, figsize=(12, 4))

ax.plot(X, Y, "o", alpha=0.3, zorder=-1)
ax.plot(X,  posterior["μ"].mean("samples"), color="C4", lw=2)
#az.plot_hdi(X[:,0], posterior["μ"].T, smooth=True)


ax.set_xlabel("hour")
ax.set_ylabel("count")
and I got the following fitted line in purple, and I am concerned about the spikes and jumps in the fitted line
While in the book the fitted line looks much smoother

I have tried to adjust the number of trees and the number of samples but the results look similar. I wonder if there is anything wrong with my code, or is there some extra agruments I should pass to pymc_bart.BART() ? Thank you!
