Hi! I want to use the az.plot_kde for 2D data, but I’d like to simplify the default aesthetics, so that all that is plotted are contours for selected hdi_probs. Could You please tell me if and how could I do that? Also, how do I control “ruggedness” of the KDE approximation? The bw arg doesn’t seem to be doing anything for me.
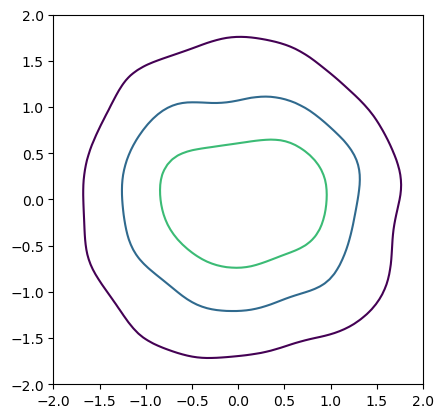
As a point of reference, below’s an example of a plot. I’d like to have only contours of the colourful pancakes, and not the pancakes themselves ![]()
import numpy as np
from scipy import stats

rng = np.random.default_rng(0)
x, y = stats.multivariate_normal(mean=[0.0, 0.0], cov=[[1, 0.0], [0.0, 1]]).rvs(1_000, random_state=rng).T

fig, axs = plt.subplots(1, 2, figsize=(8, 4))

kwargs = dict(
    hdi_probs=[0.25, 0.5, 0.75],
    contour_kwargs={"alpha": 0.0})

az.plot_kde(
    x, y,
    bw=0.01,
    ax=axs[0],
    **kwargs)
axs[0].set_title("bw=0.01")

az.plot_kde(
    x, y,
    bw=100,
    ax=axs[1],
    **kwargs)
axs[1].set_title("bw=100")

for ax in axs:
    ax.set_xlim(-2, 2)
    ax.set_ylim(-2, 2)
    ax.set_aspect("equal")